I’ve talked about a quantization of performance solutions before, and even a more accurate way to look at algorithm complexity. But it’s time to get into specifics for Android Games.
We have a game. We want to know whether it is limited by CPU or GPU performance. There are three possibilities:
- It could be CPU bound
- It could be GPU bound
- It could be some weird combination of the above two
If there is no direct way to measure this, (say for instance, your tool chain lacks a way to profile native code) but we can work it out by applying some detective skills.

1. Turn on data that gives you feedback about performance
In order to find performance issues, we must get the game into a state where we will be able to notice even small changes in performance. Ideally, we wouldn’t want this state to ship with the game, so you should add a special profiling configuration to your build that
enables various tests, insights, and provides information about performance.
Then you’ll need some way to get feedback on performance, say, adding a frame rate display, using an an inline profiler, or going for broke and adding a performance HUD to the game. Oh, and turning off vsync in this mode is also a good idea.
2. Walk through the optimization cycle
To find your bottleneck, follow these 3 steps:
- Tweak & watch. For each subsection of your game, slightly change the workload that’s being done there. If performance varies, you've found a bottleneck.
- Optimize. Given the bottlenecked stage, reduce its workload until performance stops improving or until you achieve your desired level of performance.
- Repeat. Do steps 1 and 2 again until the desired performance level is reached.
Locating the bottleneck is half the battle in optimization, because it enables you to make intelligent decisions about focusing your actual optimization efforts.
3. Know the big-picture toggles
Your CPU and GPU have multiple sub-stages that could be causing problems. Digging deep into each one may not be the best idea, but with a few high level workload toggles, you can quickly track down the things to interface with.
- CPU - Add a sleep function. Add a 1ms of work to your update loop. Does your framerate change? **Note, using sleep(1) would work, but might skew results, since it might lower CPU frequency. On more recent mobile hardware, probably better to spin-lock for 1ms...
- If frame rate Does Not change, then you are GPU Bound. The reason the frame rate did not change was because your CPU spends time waiting on the GPU to finish it’s present function each frame. (so skip to step 4).
- If your framerate DID change, then that means the GPU is idle each frame, waiting for the CPU to finish work. Adding an extra millisecond to a frame pushes back the opengl present() return call. (so skip to step 2)
- CPU - Skip an update function. Bind a keystroke to simply skip the next update function. Your rendering will remain the same, but none of your state will be updated.
- If your framerate changes, then you’re doing lots of work in your update function, and there could be optimizations to do there.
- If your framerate doesn’t change, then you’re not pushing the limits on the CPU by itself, and changes are you might be CPU->GPU interface bound (so skip to step 3)
- CPU - Skip driver calls. One of my favorite performance documents, has to be this old page detailing How to properly profile DirectX calls on the CPU. In an eye-opening view, it basically gives a table of the average cycle count for any rendering API call. OpenGL is no different; CPU side calls to the OpenGLES API is considered a Driver call, and has some overhead on the CPU. Some calls are worse than others, for example, any resource locking/updating is a synchronous operation that demands access to a GPU resource, there is the potential to massively stall the GPU pipeline, which costs both CPU and GPU cycles. To find bottlenecks here, bind a keystroke to simply skip portions of your render phase; for example, only allow the first 2,000 api calls a frame.
- Any significant variance here is important, since you’re skipping GL calls, you’re also changing how much work the GPU has to perform, which can also fluctuate your framerate.
- If making these changes produce no framerate modifications, then chances are you’re just not doing enough work on the CPU entirely, and as such, the GPU is getting backed up with tons of extra calls, creating a weird GPU bound paradox due to lack of CPU work.
- GPU - Halve the size of your back buffer. If you see performance significantly change, then you are directly fragment shading bound.
- If your framerate changes, fragment shaders are doing too much work, or there’s too much overdraw, etc etc. To help identify the problem, go to step 5.
- If the frame rate doesn’t change, there’s something deeper going on; You’re going to need a better tool chain.
- GPU - Reduce your Fragment Shader workload. Try adding a NULL shader (just draw white fragments) to your scene in place of various shaders to attempt to track down what the offending shader / instruction is.
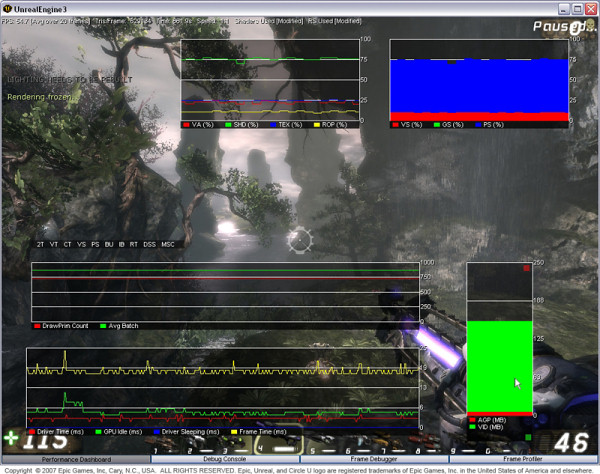
Digging deep with better tools
When it doubt, nothing beats a good old-fashioned profiling tool. Once you’ve tracked down some of the sub-areas that your performance can fall, you need to start digging deeper with more advanced developer tools. For now, each chip developer has their own suite of performance tooling that allows you to track down issues on their hardware. I suggest taking a look at each set for your given game.
You can find Colt McAnlis here:


Thanks for all the tips. They will definitely be helpful.
ReplyDeletecompare Manchester parking
meet and greet Manchester
Better tools are always necessary for better products.
ReplyDeletebuy celtic woman tickets
celtic woman tour tickets
This big picture idea seems pretty incredible. I can understand it completely.
ReplyDeleteManchester airport cheap parking
Manchester park and ride